Pythonモジュール「Matplotlib」を用いて、2次元グラフに円を描画する方法をソースコード付きでまとめました。
Matplotlibでは、「matplotlib.patches.Circle」を使って2次元グラフに円を描くことができます。
今回はそれを使ってみました。
| – | 公式リファレンス |
|---|---|
| 参考 | matplotlib.patches.Circle |
ソースコード
サンプルプログラムのソースコードです。
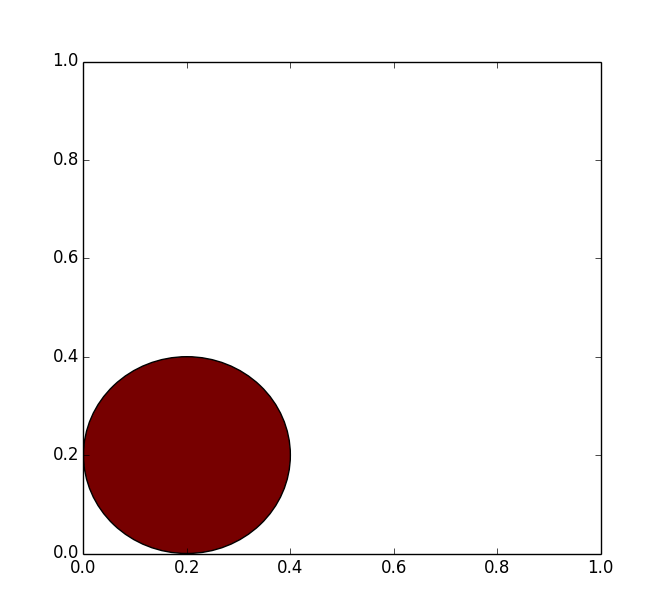
# -*- coding: utf-8 -*-
import matplotlib
import matplotlib.pyplot as plt

fig = plt.figure()
ax = fig.add_subplot(111)

# 中心(0.2,0.2)で半径0.2の円を描画
circle = plt.Circle((0.2,0.2),0.2,fc="#770000")
ax.add_patch(circle)

plt.show()
サンプルプログラムの実行結果です。

【Matplotlib超入門】使い方の解説とサンプルコード集
Pythonモジュール「Matplotlib」でグラフを作成する方法をサンプルコード付きで入門者向けにまとめました。
python.joho.info
2024.06.30

コメント