この記事では、Python言語とNumPyを用いて、配列のデータを直交座標系から極座標系に変換する方法をソースコード付きで解説します。
直交座標系→極座標系
PythonモジュールNumPyでは、sqrtメソッドとarctan2メソッドで配列の値を直交座標系から極座標系に一括変換できます。
ソースコード
サンプルプログラムのソースコードです。
# -*- coding: utf-8
import numpy as np
import matplotlib.pyplot as plt

def main():
    # 配列生成
    x = np.random.randint(1,5,5)
    y = np.random.randint(1,5,5)

    # 直交座標系 → 極座標系
    radii = np.sqrt(x**2 + y**2)
    theta = np.arctan2(y,x)

    # 直交系グラフ
    ax1 = plt.subplot(1,2,1)
    ax1.scatter(x,y)
    ax1.axis([0,10,0,10])
    ax1.grid(True)

    # 極座標系グラフ
    ax2 = plt.subplot(1,2,2,polar=True)
    ax2.scatter(theta,radii)
    ax2.set_rmax(10)
    ax2.grid(True)

    plt.show()


if __name__ == "__main__":
    main()
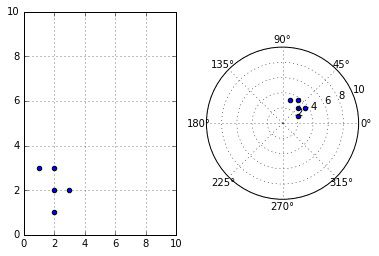
実行結果
サンプルプログラムの実行結果は下記の通りです。

コメント